Logo MBIE Logo DOC

Resources

Credit: Unsplash

Higher-spending visitors in the IVS

June 05, 2019

This article was produced by the Ministry of Business, Innovation and Employment (MBIE). The content you find below is exclusive to the Tourism Evidence and Insights Centre.

The analysis below uses data from the International Visitor Survey (IVS) to understand the characteristics of visitors who spend higher amounts per day when they are in New Zealand. Key findings are:

We have defined higher-spending visitors as the top ten per cent spend per day

Higher-spending visitors are important to the wider tourism industry. An aim of the Government’s Tourism Strategy is to improve productivity of the sector by increasing value over volume. Attracting higher value visitors is one way to do this. A partnership between Auckland Tourism, Events and Economic Development (ATEED), UnionPay International and Immigration New Zealand aimed at attracting more “high-value” Chinese visitors to New Zealand during shoulder and the off-peak season was announced in February 2019.

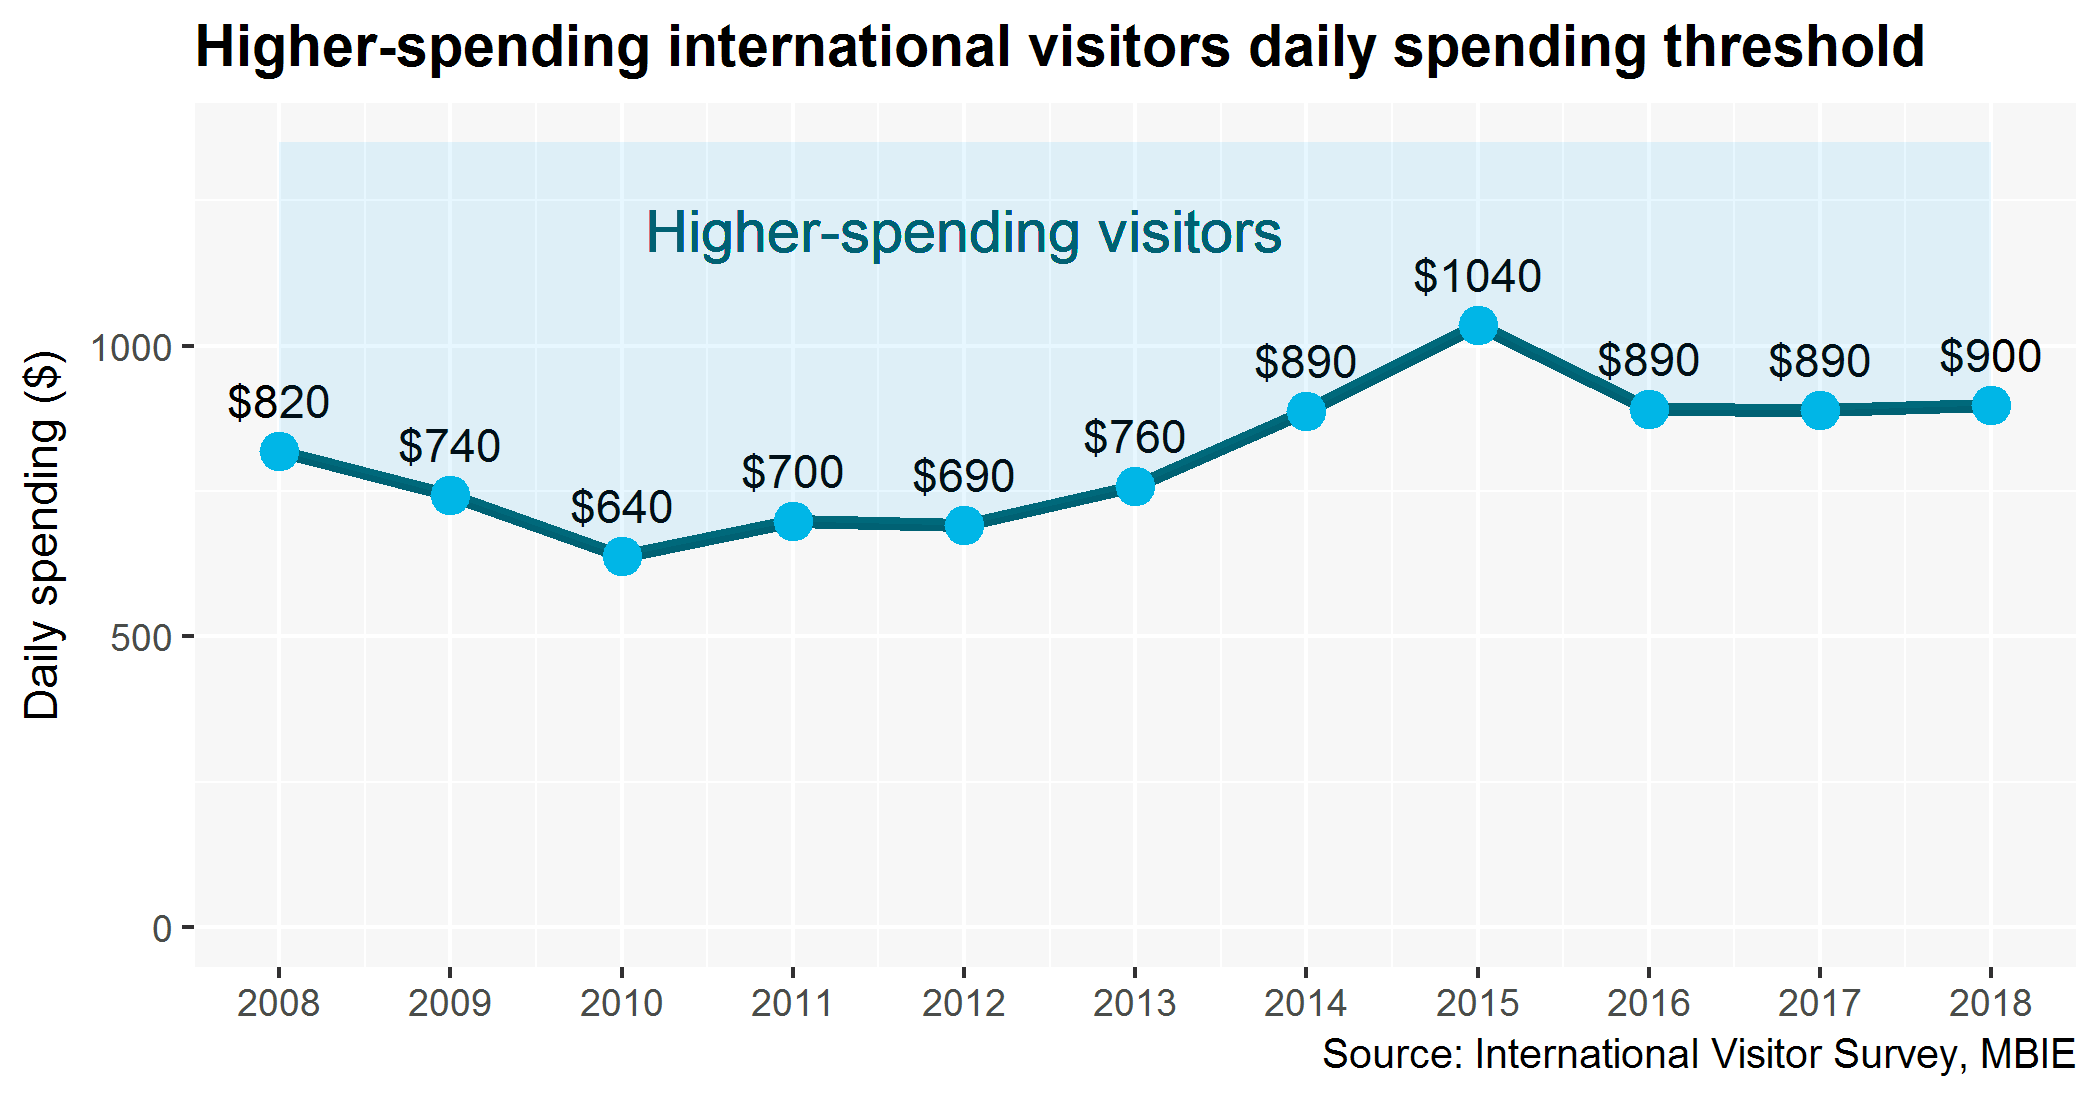
Understanding these visitors is challenging, because they are often difficult to identify and collect information on. However, we do see some higher-spending visitors in the IVS data. As there is no internationally recognised definition of higher-spending visitors, we have defined them as the top 10 per cent of visitors by spend-per-day. The 10 per cent threshold values were calculated for the 2008 to 2018 period. The 10 per cent threshold means that the exact expenditure that higher-spending visitors must meet will change between years.

The plot below shows this threshold. For example, in the year 2016, higher-spending visitors are defined as those visitors whose daily spending averaged above $890 NZD. The threshold value for the year 2015 ($1,040 per day) is the largest value seen over the last ten years.

Daily spending
This graph shows the 10 per cent threshold values calculated in New Zealand dollars for the 2008 to 2019 period. The 10 per cent threshold represents the top 10 per cent visitors by spend-by-day, or the 10 per cent visitors spending the most per day. Source: International Visitor Survey, from MBIE.

Please be aware that the data used in this analysis, comes from the International Visitor Survey which is subject to a degree of sample error. As such, it is more usuful to look at longer term trends rather than individual years.

Higher-spending visitors made up a fifth of visitor spend

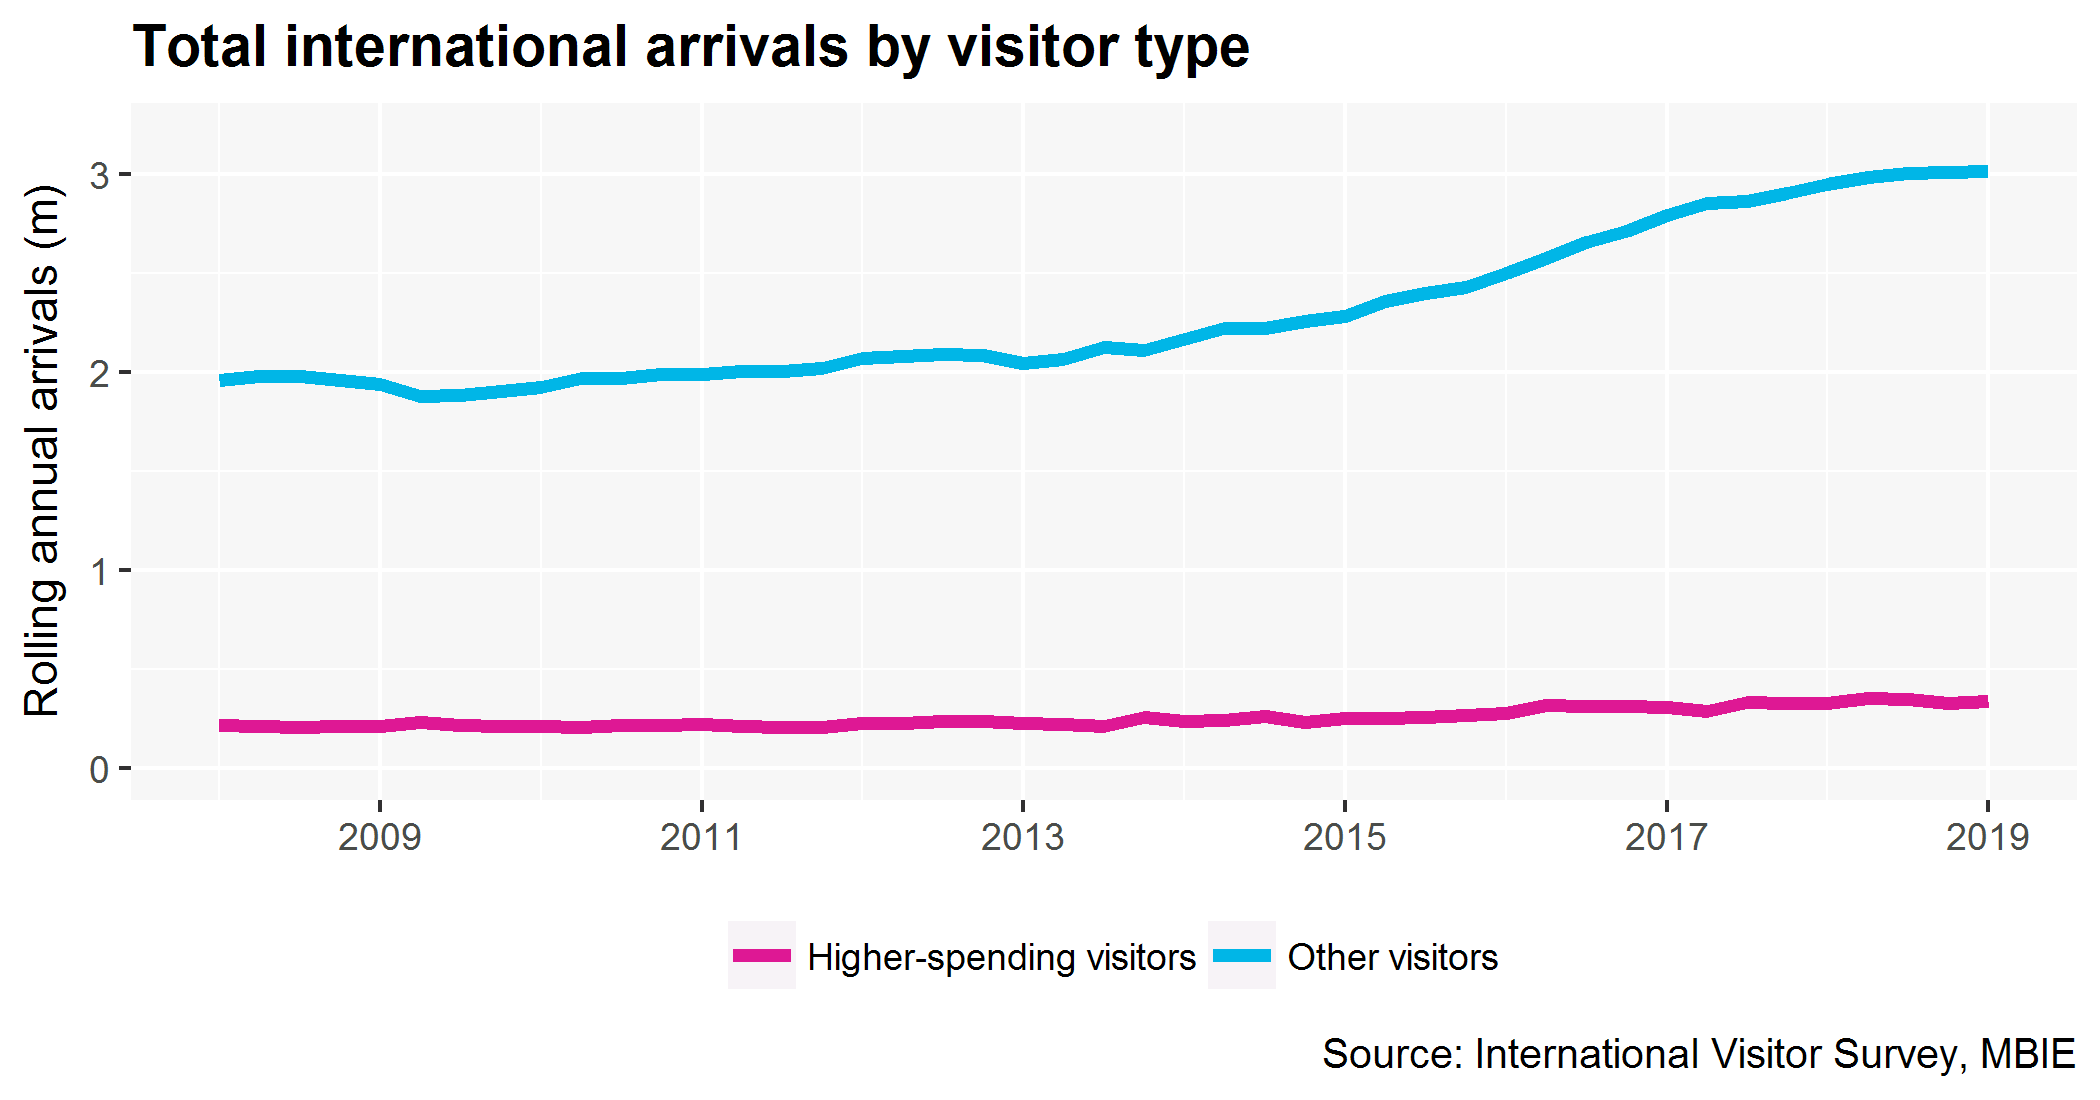
For the year ended December 2018, higher-spending visitors spent $2.3 billion in total, equating to 21 per cent of the total international visitor spend in New Zealand. This worked out at around 338,000 higher-spending visitors.

Total international spend by visitor type
This graph shows the rolling annual spend in New Zealand dollars for the visitors classified as higher-spending visitors and for the other visitors, during the 2008 to 2019 period. Higher-spending visitors represent the top 10 per cent of visitors by spend-per-day. Source: International Visitor Survey, from MBIE.
Total international arrivals by visitor type
This graph shows the rolling annual arrivals for the visitors classified as higher-spending visitors and for the other visitors, during the 2008 to 2019 period. Higher-spending visitors represent the top 10 per cent of visitors by spend-per-day. Source: International Visitor Survey, from MBIE.

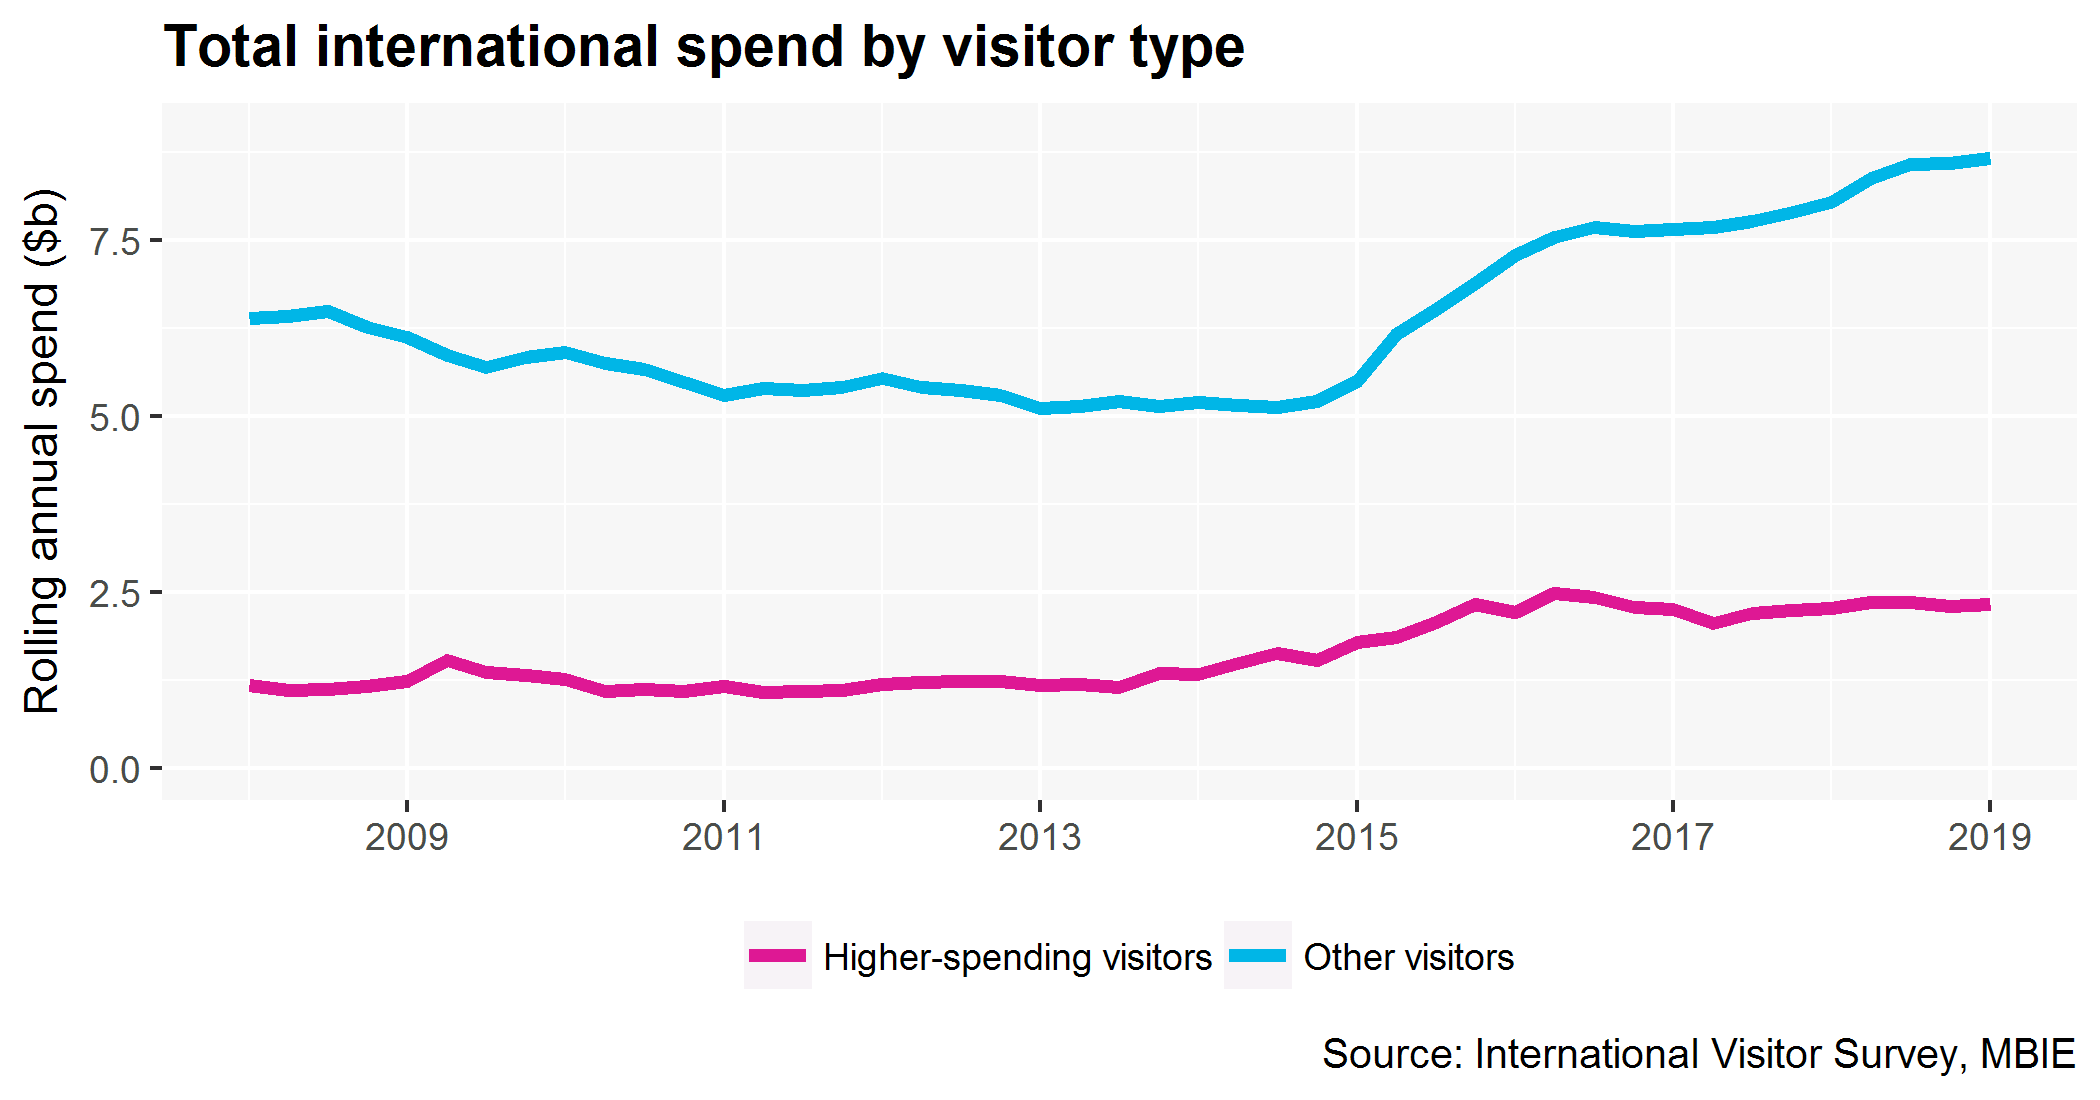
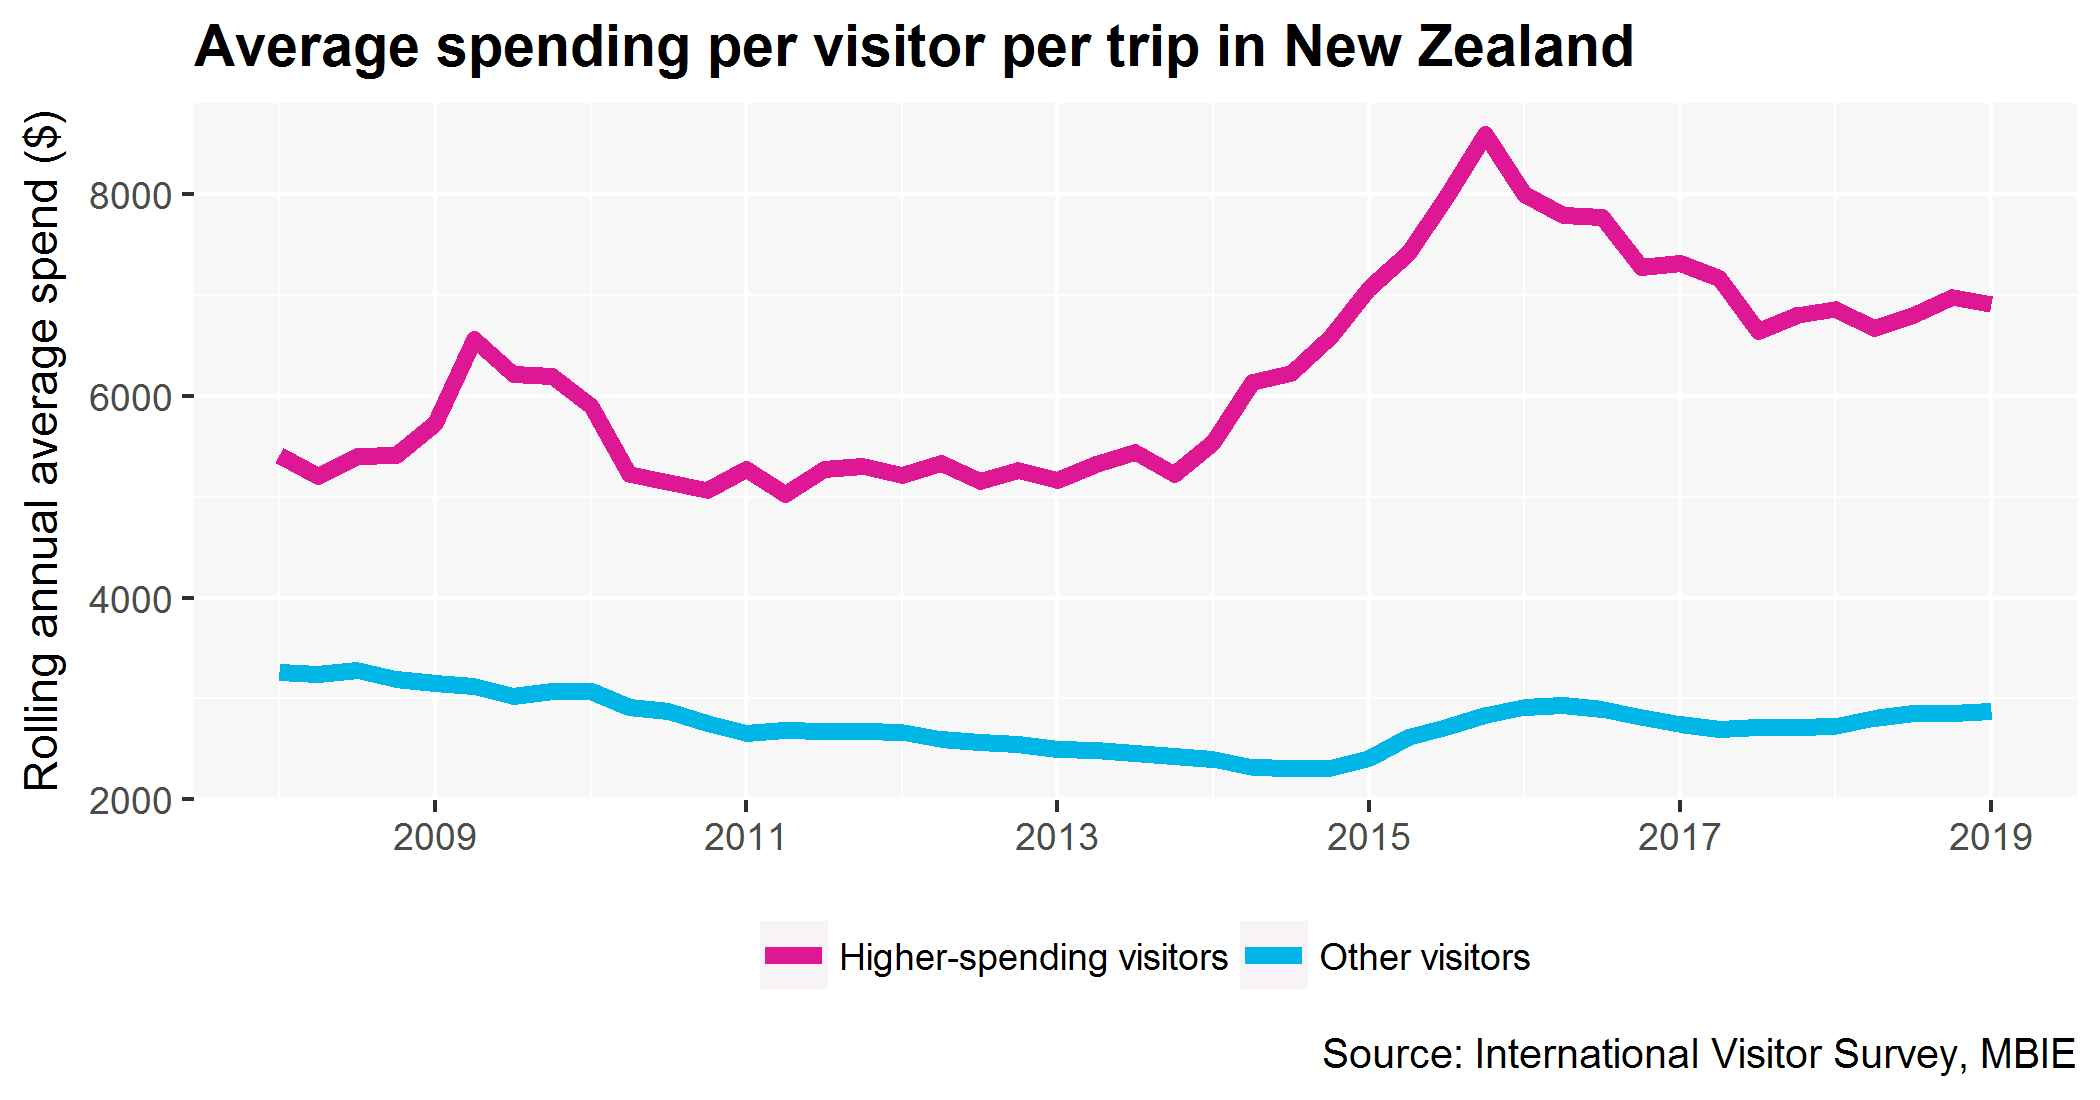
The average spending of higher-spending visitors was around $6,900, more than double the average expenditure of other visitors (approximately $3,300).

Average spending per visitor per trip in New Zealand
This graph shows the rolling annual average spend in New Zealand dollars for the visitors classified as higher-spending visitors and for the other visitors, during the 2008 to 2019 period. Higher-spending visitors represent the top 10 per cent of visitors by spend-per-day. Source: International Visitor Survey, from MBIE.

Most higher-spending visitors were in New Zealand for a holiday

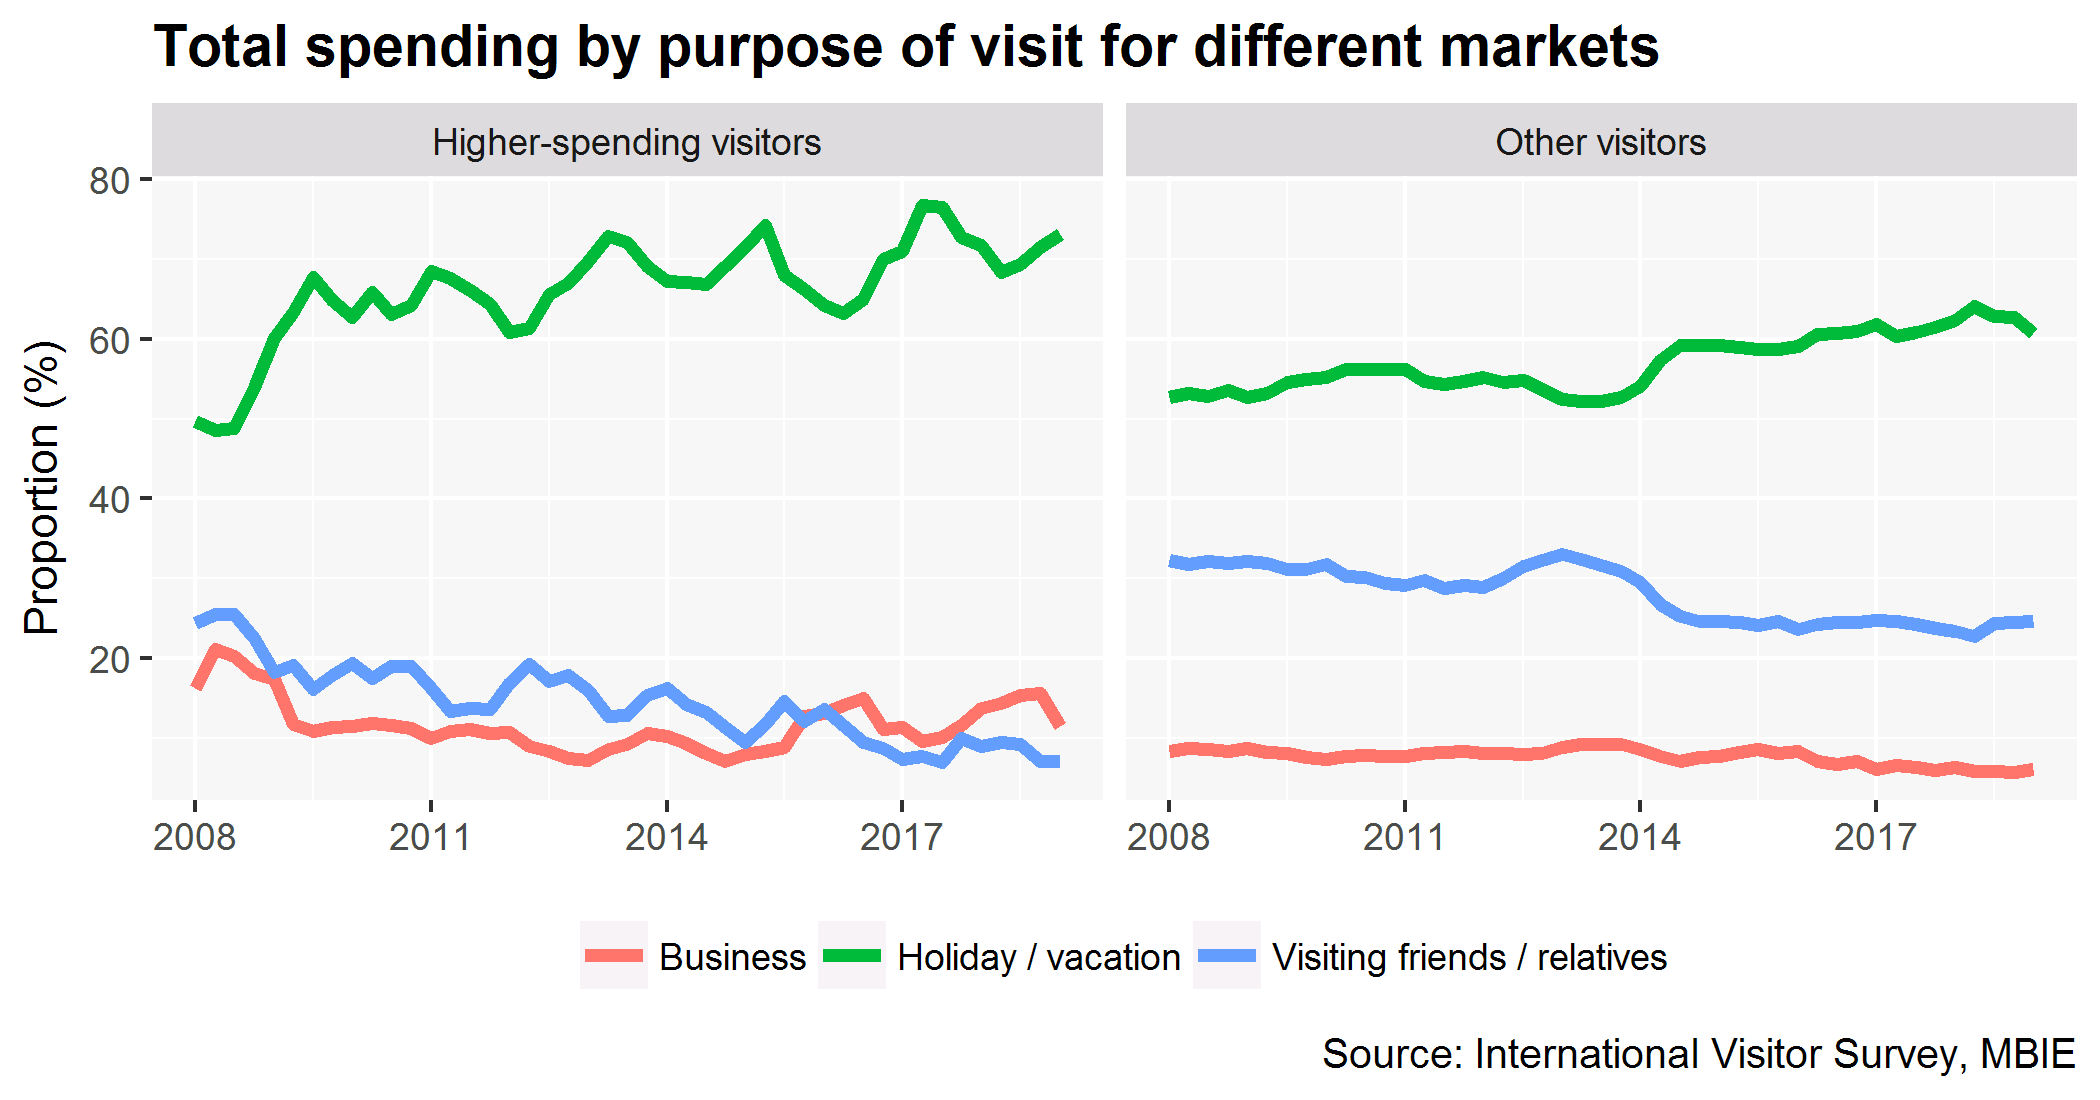
Higher-spending visitors were most likely to come to New Zealand for a holiday, similar to the overall visitor trend. Higher-spending holidaymakers made up approximately 66 per cent of all higher-spending international arrivals in the year ended December 2018, yet made up around 73 per cent of spend. In contrast, higher-spending visitors for visiting friends and relatives (VFR) made up of 6.5 per cent of all higher-spending arrivals and made up 7 per cent of all higher-spending visitors.

Not surprisingly, VFR visitors were less likely to be higher-spending visitors. VFR are widely acknowledge to have lower average spend and are likely to spend less on products such as accommodation.

Proportion of spending by purpose of visit for higher-spending visitor and others
This graph shows the proportion of spending by purpose of visit (i.e. Business, Holiday or Vacation, and Visiting friends or relatives) for visitors classified as higher-spending visitors and for the other visitors, during the 2008 to 2019 period. Higher-spending visitors represent the top 10 per cent of visitors by spend-per-day. Source: International Visitor Survey, from MBIE.

Higher spending visitors were more likely to stay in hotel accommodation

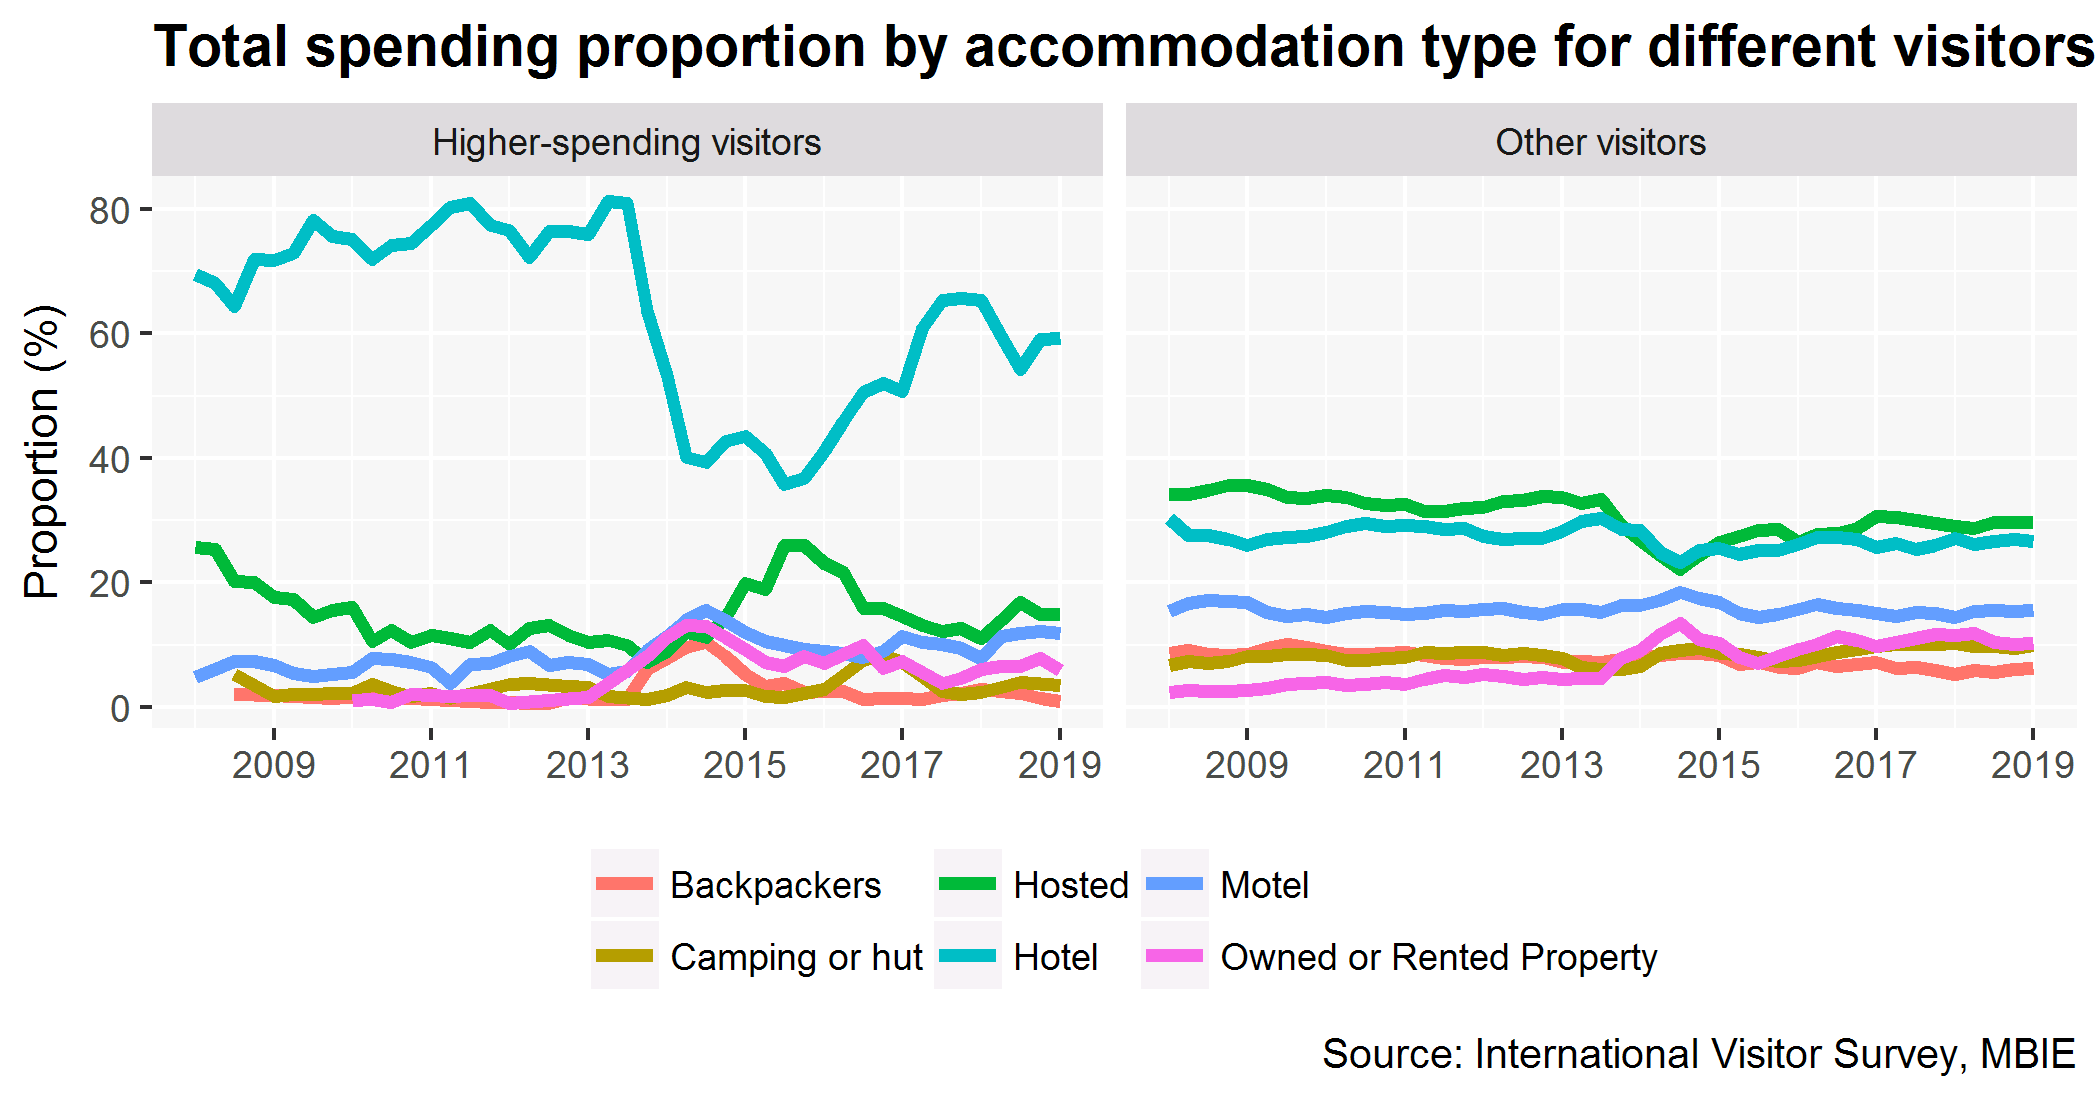
A higher proportion of higher-spending visitors stayed in hotel accommodation compared to other visitors. Higher-spending visitors were less likely to stay at hosted accommodation, compared with other visitors.

Proportion of spending by accommodation type for higher-spending visitor and others
This graph shows the proportion of spending by accommodation type (i.e. Backpackers, Hosted, Motel, Camping or hut, Hotel, Owned or Rented Property) for visitors classified as higher-spending visitors and for other visitors, during the 2008 to 2019 period. Higher-spending visitors represent the top 10 per cent of visitors by spend-per-day. Source: International Visitor Survey, from MBIE.

Higher-spending visitors tend to be older than other visitors

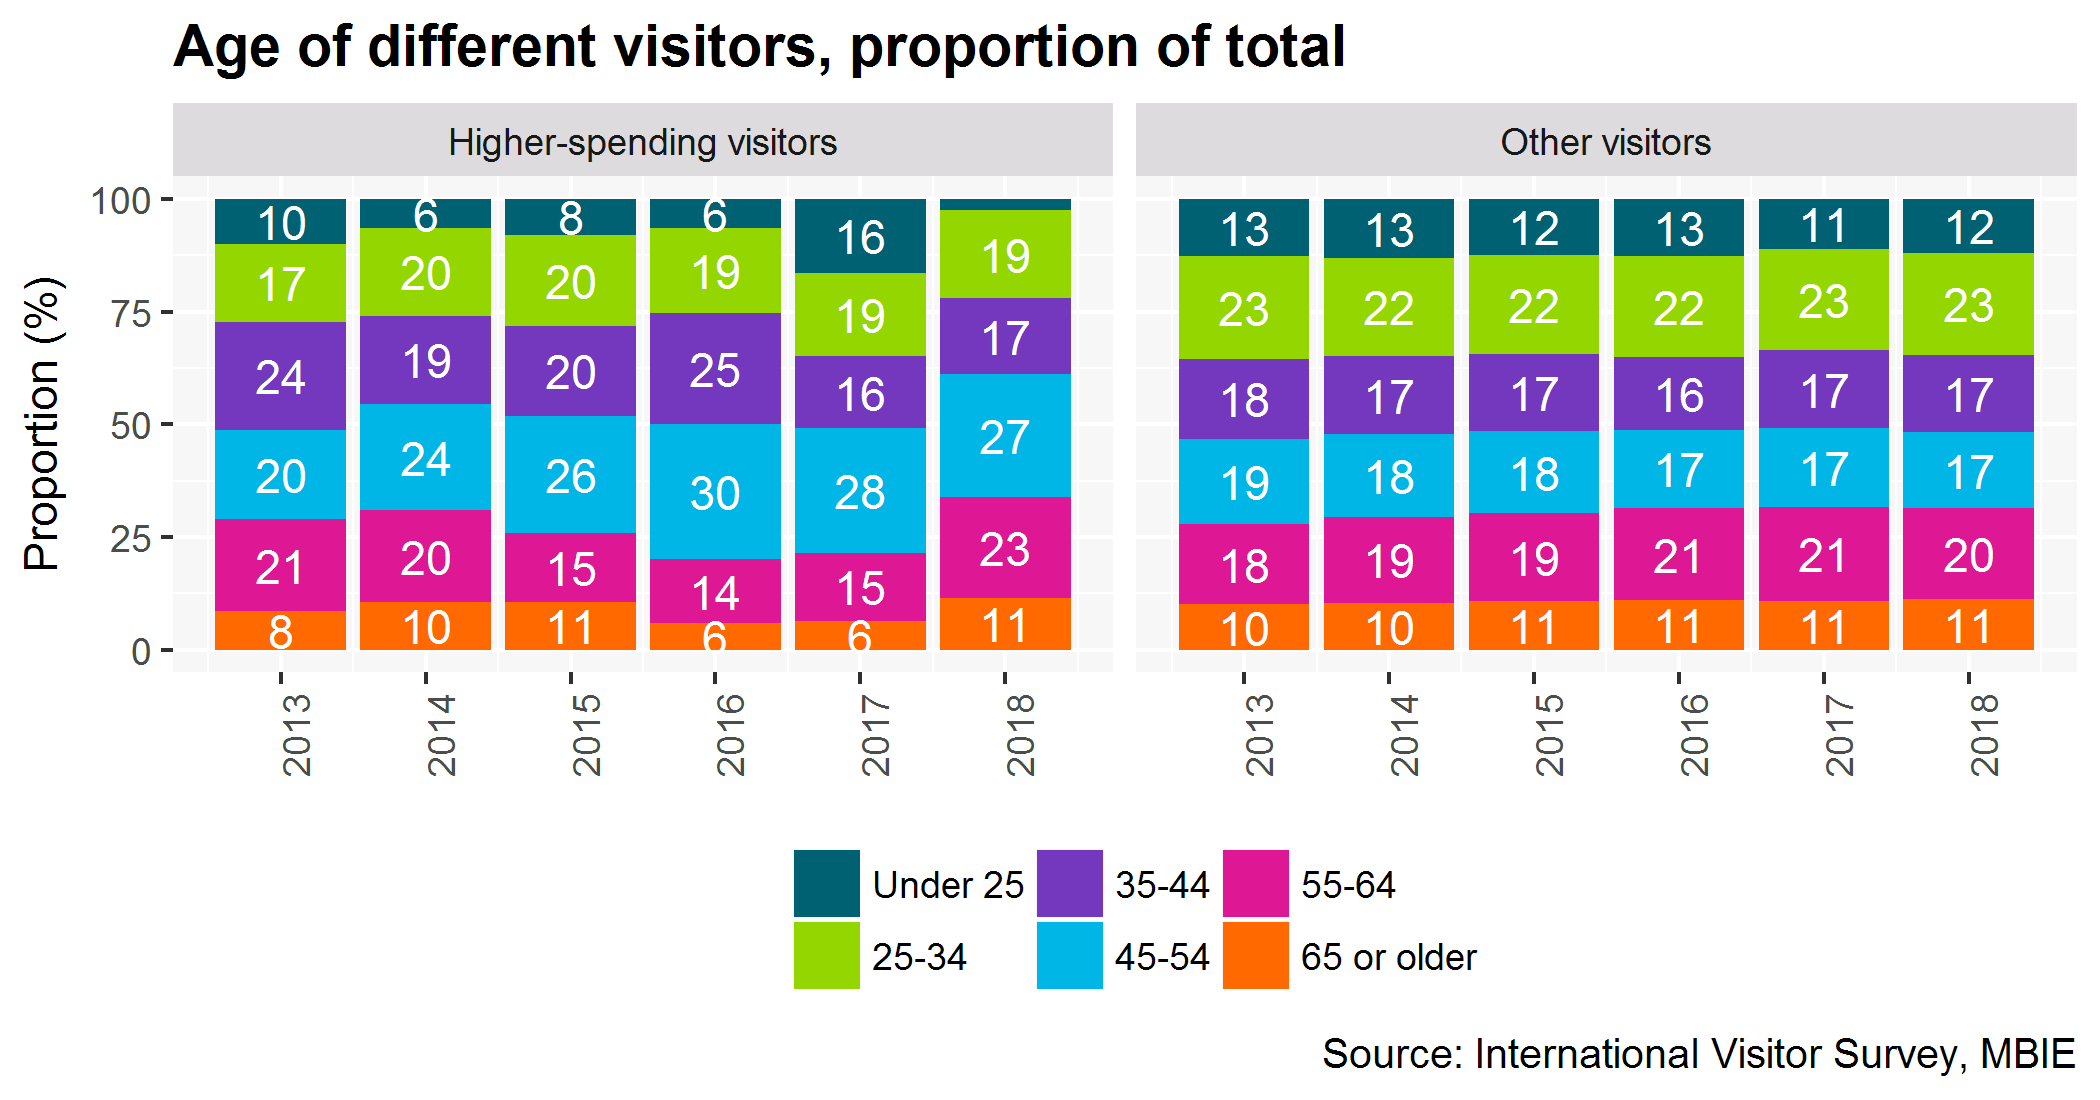
The plot below shows the proportion of visitors by age in each year. In the year ending December 2018, 50 per cent of higher-spending visitors were aged between 45 and 64 years old, while the same age range made up only 37 per cent of other visitors.

Proportion of visitors by age for higher-spending visitor and others
This graph shows the proportion of visitors by age for visitors classified as higher-spending visitors and for other visitors, during the 2013 to 2018 period. Higher-spending visitors represent the top 10 per cent of visitors by spend-per-day. Source: International Visitor Survey, from MBIE.

They stayed for shorter periods than other visitors

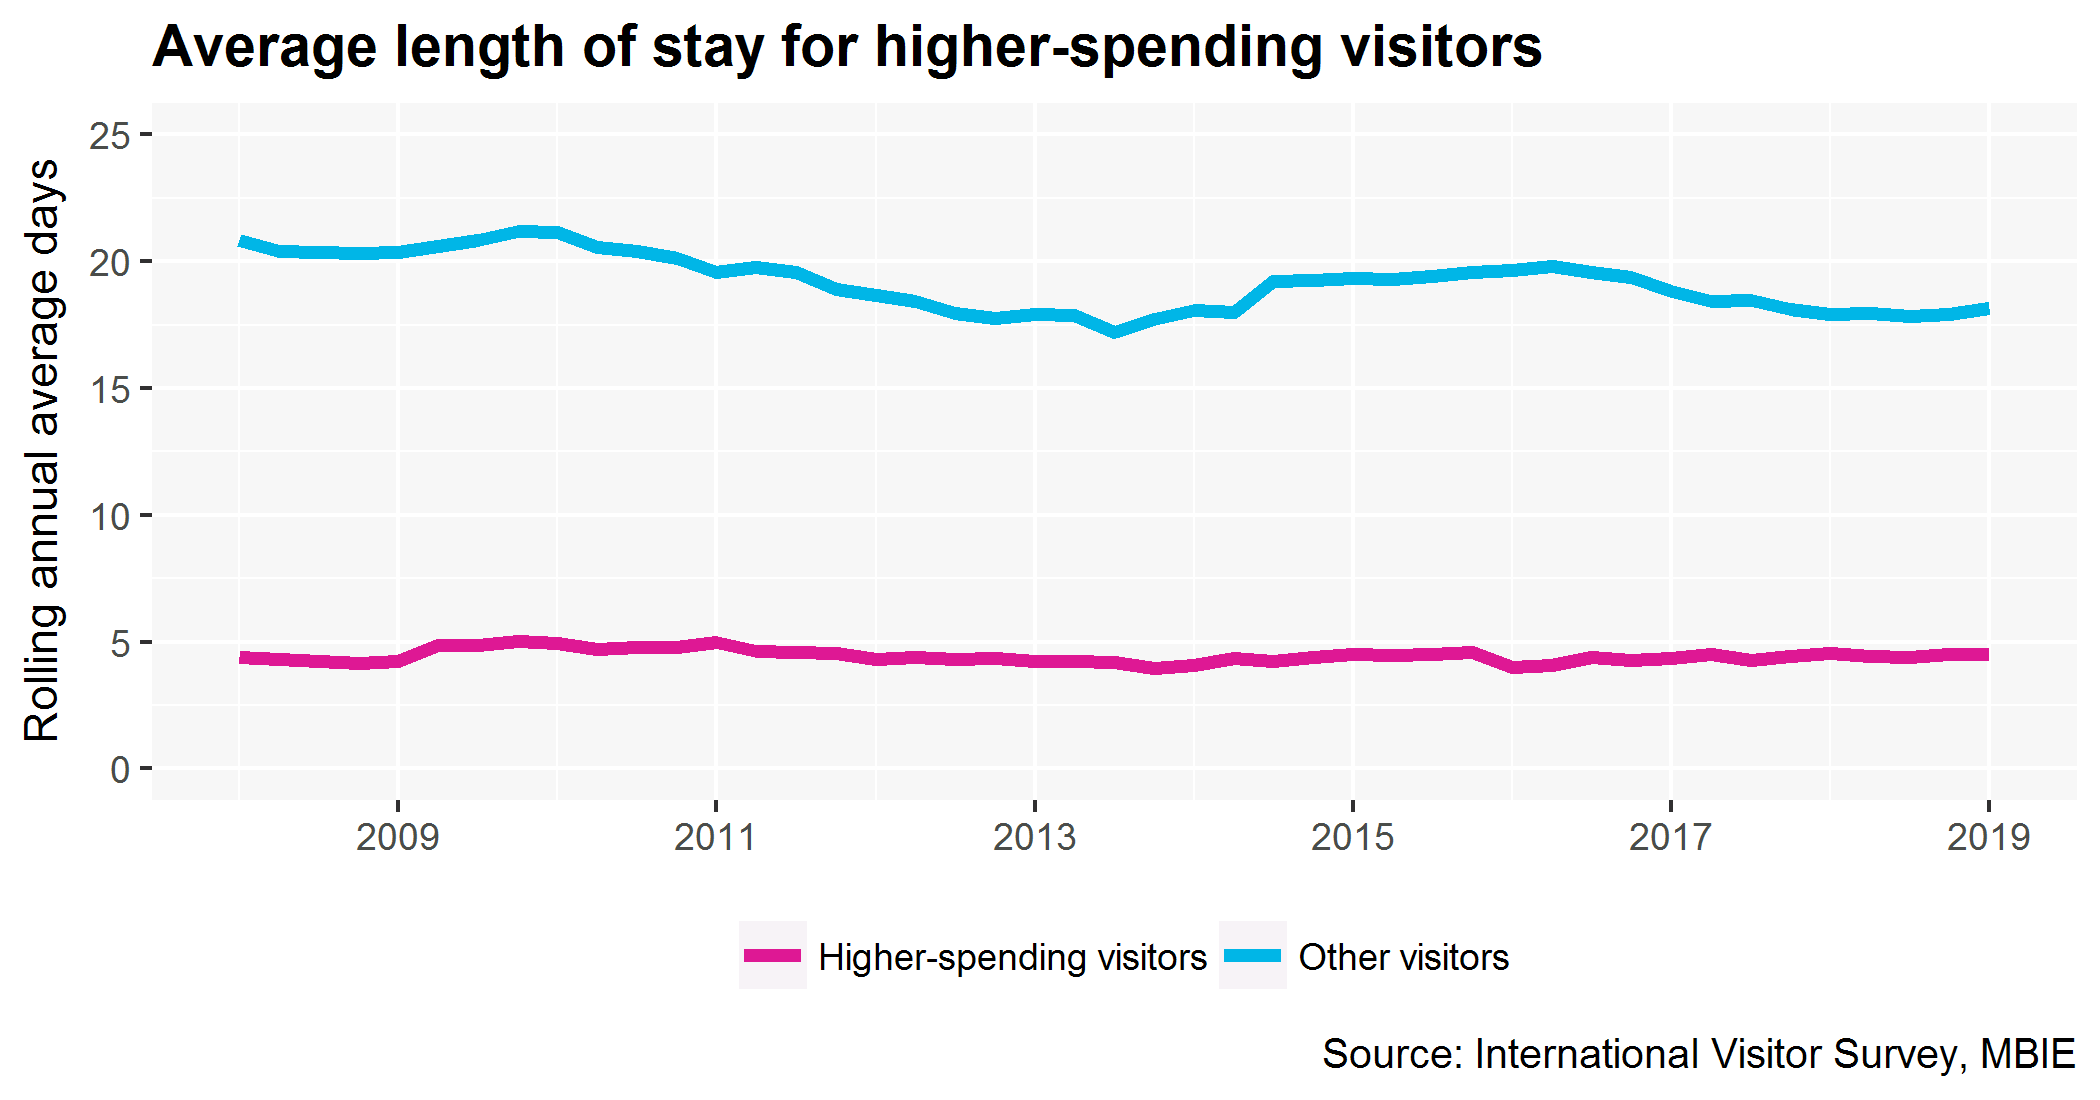
Higher-spending visitors spent on average five days in New Zealand, compared to 20 days for other visitors. So, despite spending a higher amount per day, higher-spending visitors may have spent less overall when compared to other visitors.

Average length of stay for higher-spending visitors
This graph shows the average length of stay for visitors classified as higher-spending visitors and for other visitors, during the 2008 to 2019 period. Higher-spending visitors represent the top 10 per cent of visitors by spend-per-day. Source: International Visitor Survey, from MBIE.

Higher-spending visitors were more likely to visit Queenstown

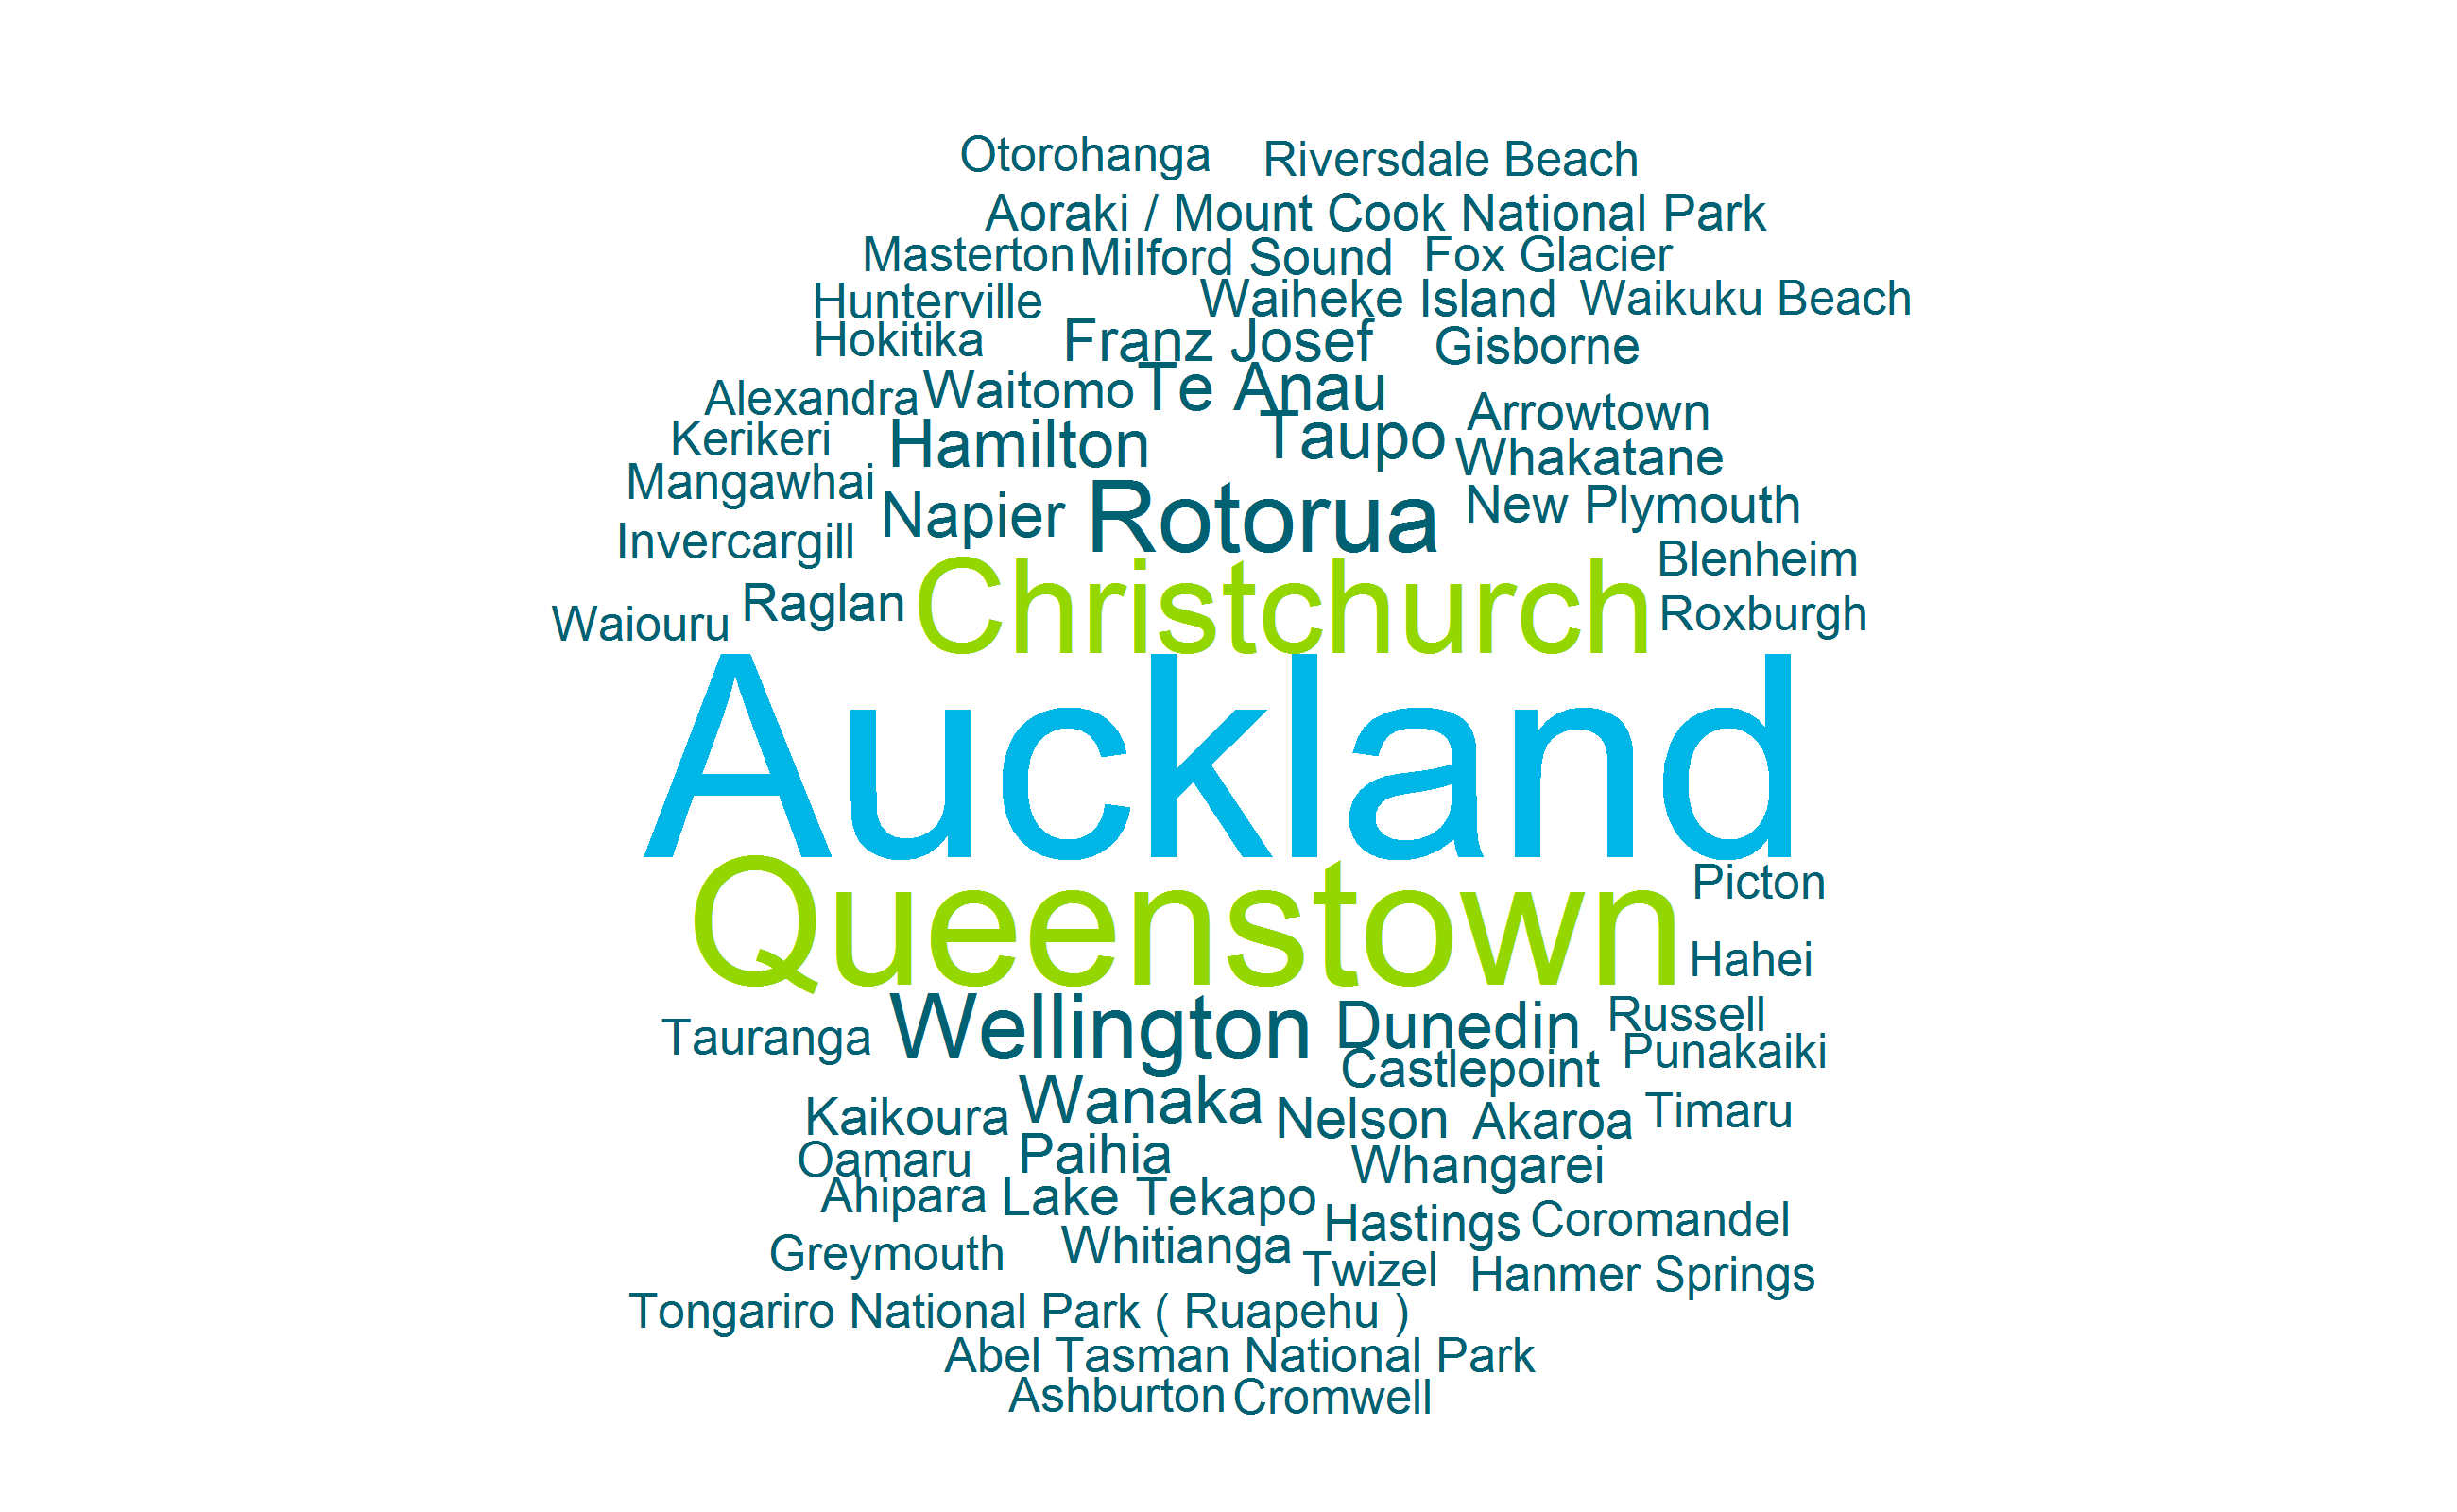
For the year ended December 2018, higher-spending visitors were most likely to visit Auckland, followed by Queenstown, Christchurch, Rotorua and Wellington. These visitors were more likely to state they had been to Queenstown than other visitors. This could suggest the high price of accommodation in Queenstown is less of a deterrent for higher-spending visitors than other visitors.

The wordcloud below presents the most commonly-cited places visited by higher-spending visitors:

Wordcloud with the most commonly-cited places visited by higher-spending visitors
This graph shows a wordcloud with the most commonly-cited places visited by visitors classified as higher-spending visitors in 2018. Higher-spending visitors represent the top 10 per cent of visitors by spend-per-day. Source: International Visitor Survey, from MBIE.

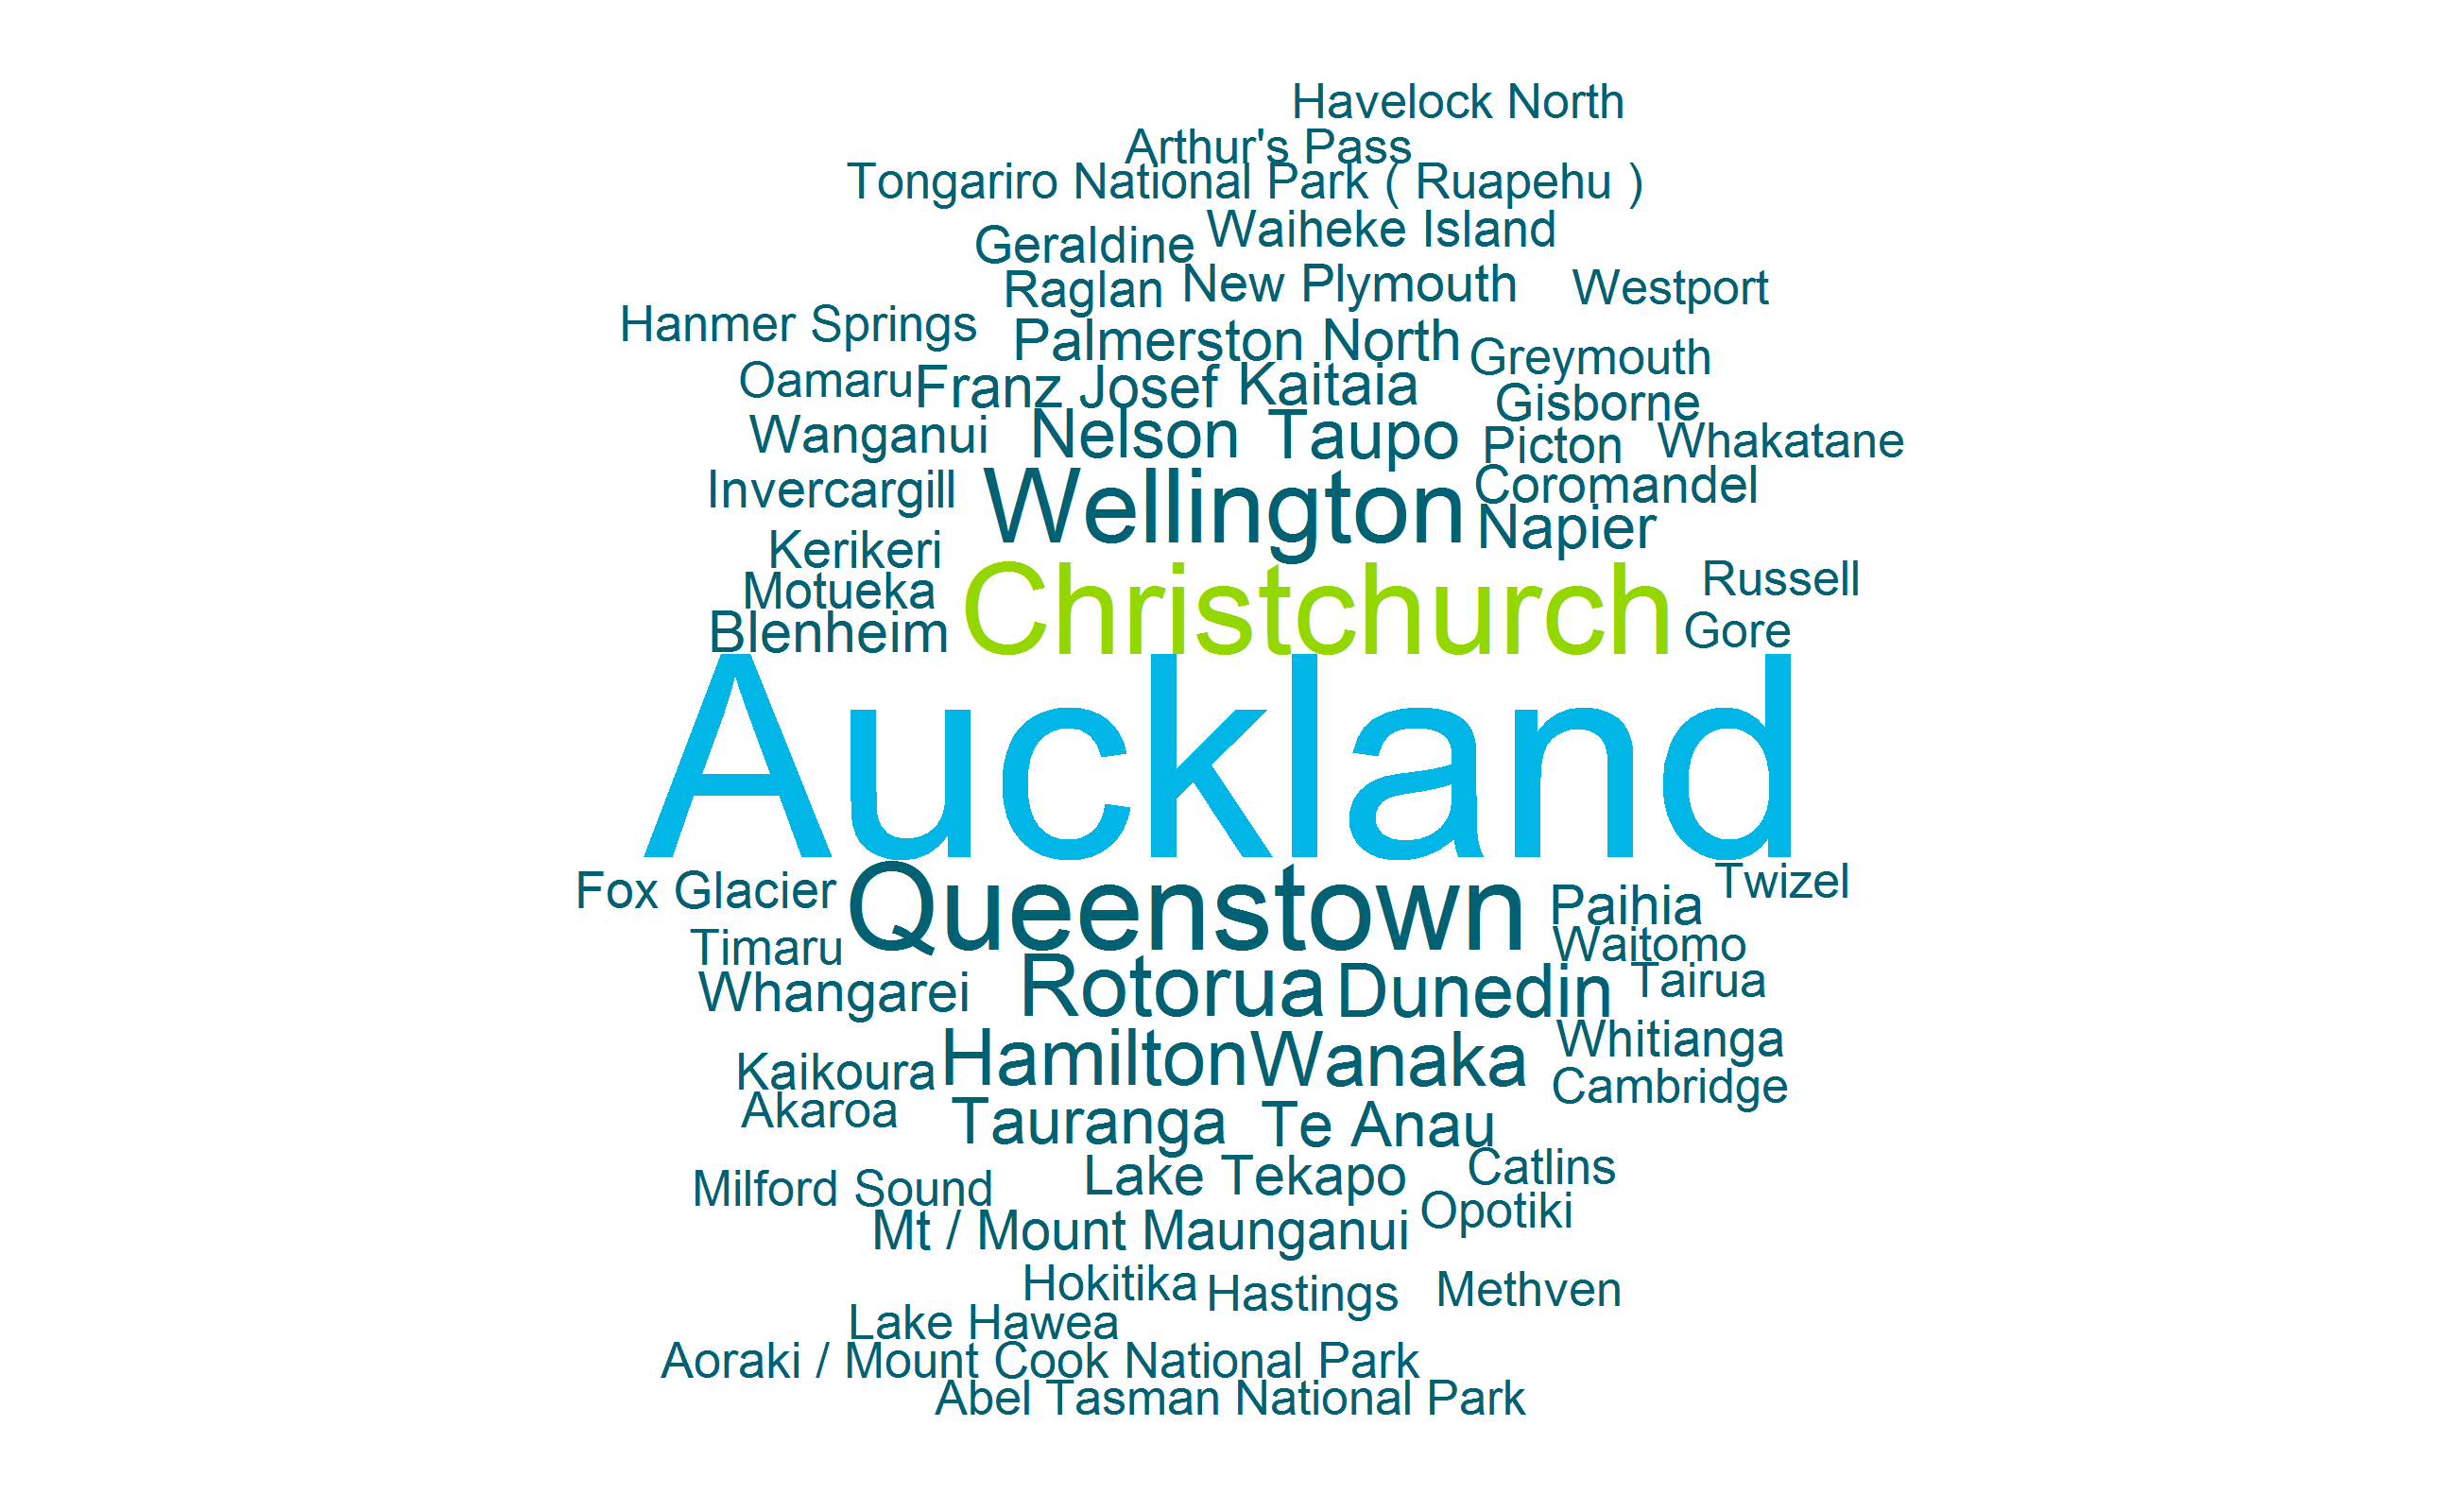
The graph below presents the most commonly cited places visited by other visitors:

Wordcloud with the most commonly-cited places visited by other visitors
This graph shows a wordcloud with the most commonly-cited places visited by visitors others, or visitors not classified as higher-spending visitors in 2018. Higher-spending visitors represent the top 10 per cent of visitors by spend-per-day. Source: International Visitor Survey, from MBIE.

Chinese visitors contributed the most to the higher-spending visitor market

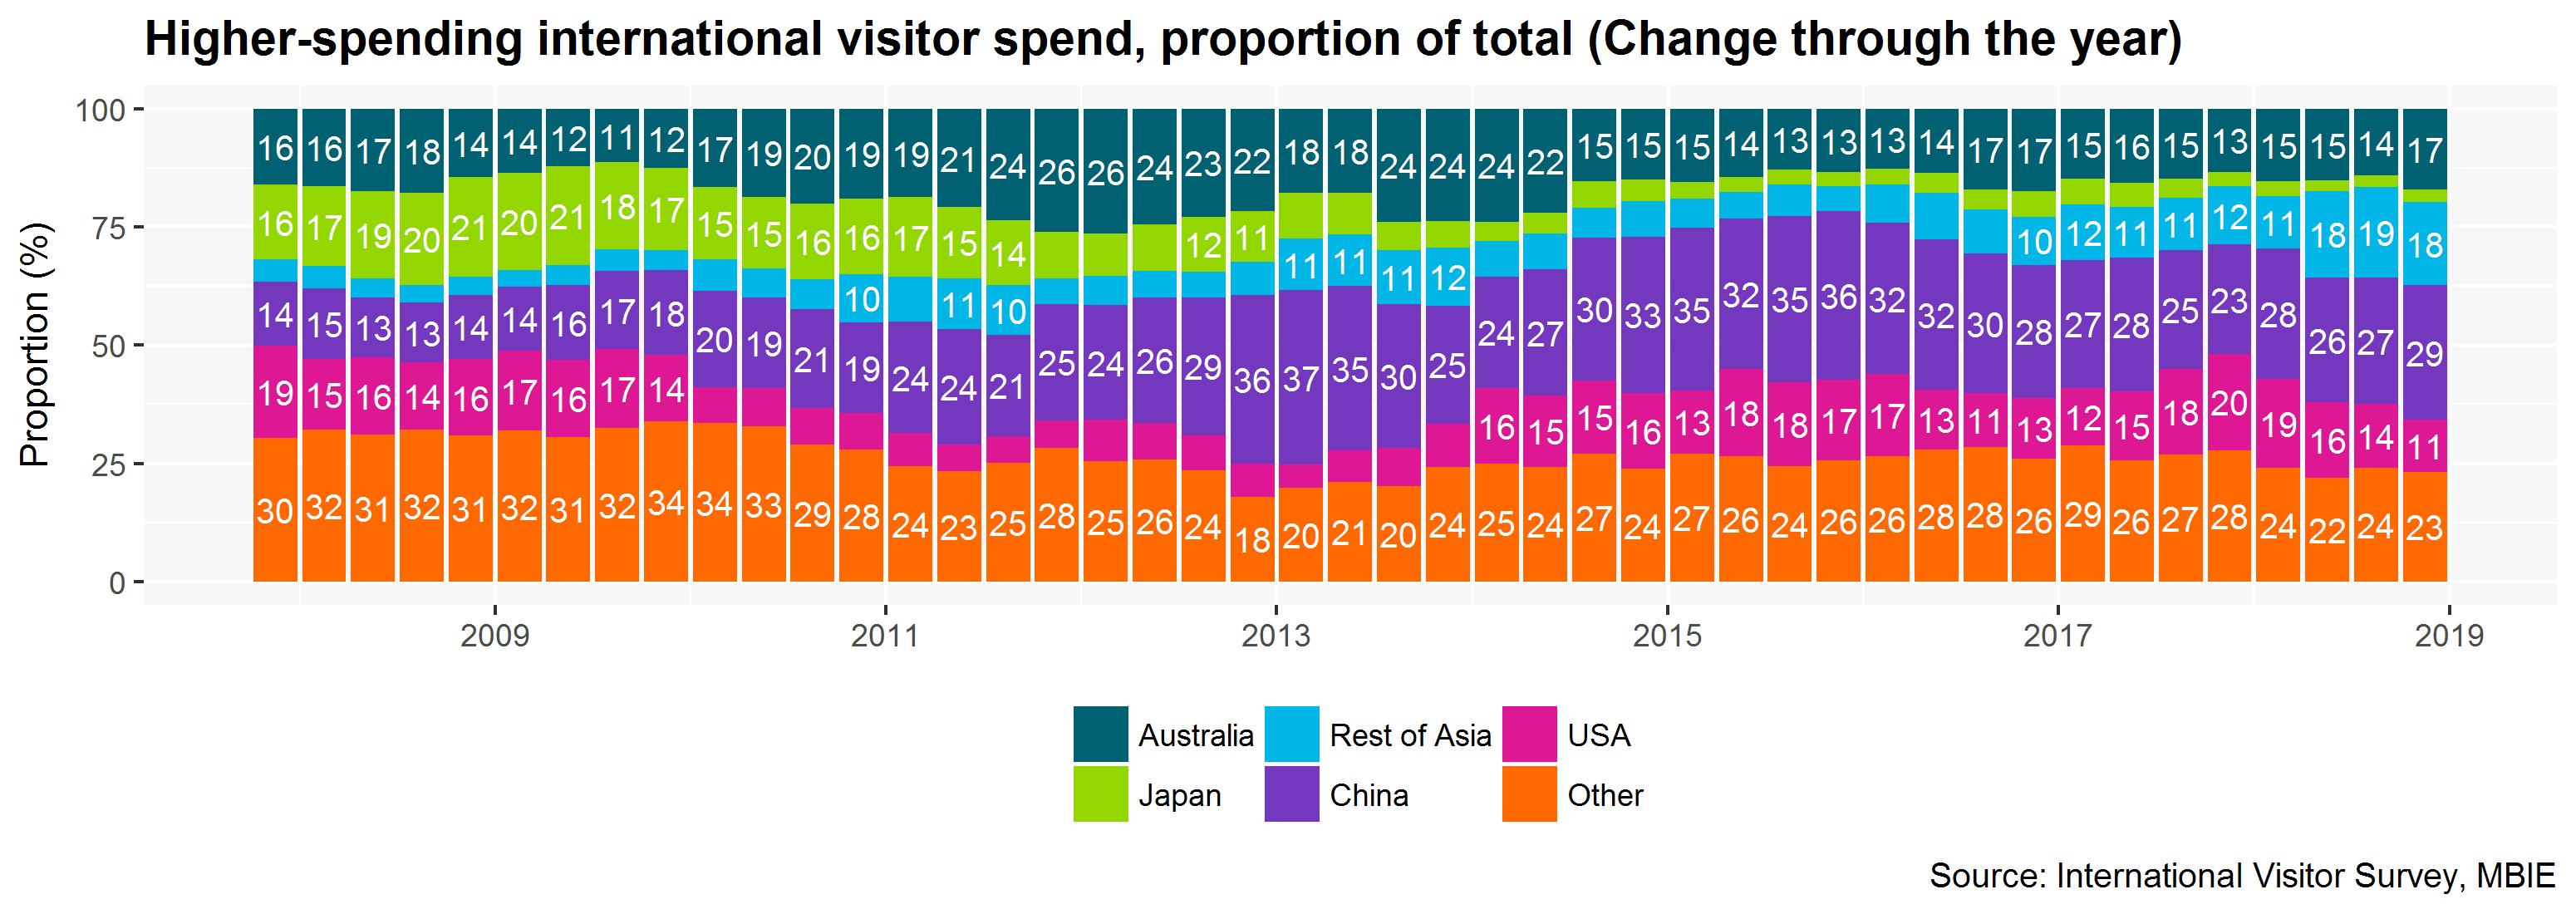
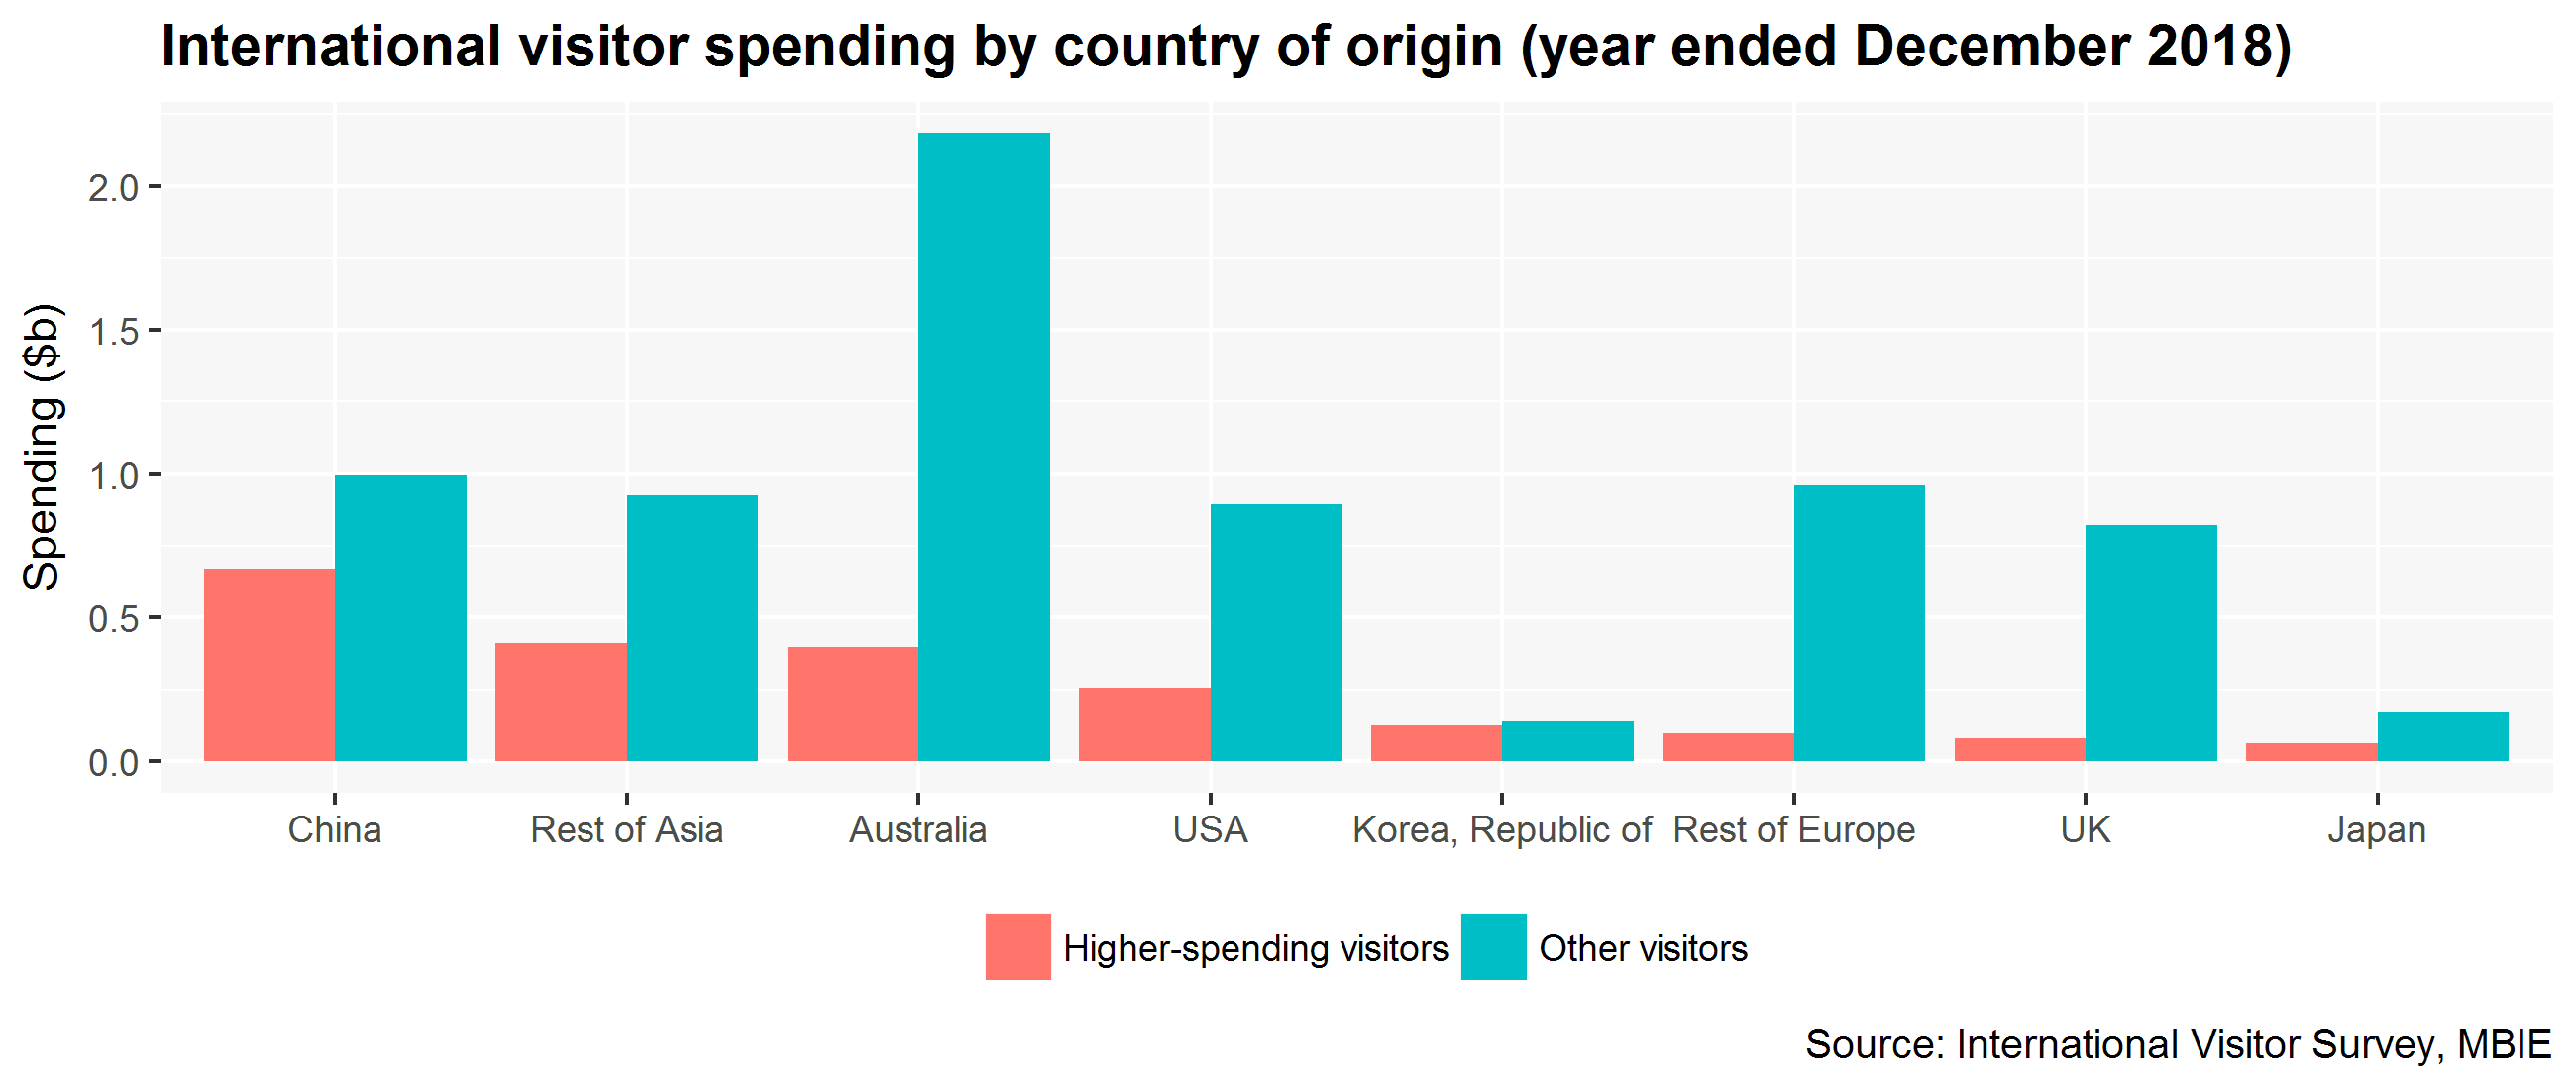
For the year ended December 2018, Chinese visitors contributed the most to the overall higher-spending visitor market (29 per cent, or $670m), followed by Rest of Asia (18 per cent), Australia (17 per cent) and the USA (11 per cent).

International visitor spending by country of origin, year ending December 2018
This graph shows international spending in New Zealand dollars for the year ending December 2018 for visitors classified as higher-spending visitors and for other visitors. Higher-spending visitors represent the top 10 per cent of visitors by spend-per-day. Source: International Visitor Survey, from MBIE.

Higher-spending visitors from the rest of Asia has shown strong growth in spend over the last few years. However, this data should be treated with caution, as the International Visitor Survey is not designed to provide accurate estimates of the rest of Asia market.

Higher-spending international visitor spending by country of origin
This graph shows quarterly international spending from higher-spending visitors as a proportion of total spending by market of origin for the 2008 to 2019 period. Higher-spending visitors represent the top 10 per cent of visitors by spend-per-day. Source: International Visitor Survey, from MBIE.